<style>
details {
margin-top: 0.5em;
margin-bottom: 0.5em
}
summary {
font-weight: bolder;
}
summary:hover {
text-decoration: underline;
}
blockquote {
font-size: 16px;
}
section {
padding: 0em 1em;
padding-bottom: 1em;
padding-top: 1em;
border-radius: 4px;
background-color: #f7f7f7;
border: 1px solid #ccc;
}
.todo {
color: #ff00ff;
border: 2px dashed #ff00ff;
padding: 0em 1em;
border-radius: 5px;
margin-top: 1em;
margin-bottom: 1em;
//display: none; // UNCOMMENT TO HIDE TODOs
}
</style>
**[« Back to the main CS 300 website](https://csci0300.github.io)**
# Lab 3: Assembly and Buffer Overflow
**Due**: Wednesday, March 11 at 8:00 PM
In this lab we will be working with **x86-64 Assembly Code**! :sparkles:
The point of this lab is to get a basic understanding of how a computer navigates through a program's execution at a fundamental level. That being said, we don't expect you to remember how *every* detail of how assembly works.
Once a program is compiled into an executable, understanding what it does becomes a challenge. Since a great way to understand how something works is to understand how to break it, you'll be **hacking assembly programs**.
<details><summary>Remind me what assembly code is?</summary>
:::info
Assembly code is basically a human-readable version of machine instructions. Assembly code has a one-to-one mapping with machine code. That is, each assembly instruction specifies one specific action for the CPU to perform.
Assembly is not compiled; it is "assembled" into an executable. Each assembly instruction is translated directly into a machine instruction (binary).
:::
</details>
<details><summary>Remind me what registers are?</summary>
>
:::info
Registers are memory cells on the CPU that are accessed and manipulated with machine instructions (which can be described in assembly language).
Special control registers define the CPU operating state. Other registers are used for passing arguments and storing variables temporarily.
:::
</details>
### Notes on Machine Architecture
Remember that machine code (and assembly) are specific to computer's hardware **architecture**. Intel/AMD x86-64 is the most common architecture for desktop, laptop, and server computers today, but recently another architecture, ARM64, has taken hold with "Apple Silicon" (M1/M2/M3/M4/...) machines.
In this lab, you will be working with x86-64 assembly code, no matter what architecture your machine has. This means that if you're using an ARM64 machine (like M1/M2/M3/M4 Macs), you will need to emulate an x86-64 machine for the assignment.
Don't worry, though, we've done our best to make this easy: we've set up our makefiles and stencil scripts to simplify the process. However, please note that **some instructions in this lab are different depending on your architecture**--please make sure you select the instructions that work for your system!
If you want to check whether your system is x86-64 or ARM64, please run the following command in your container, which lists info about your operating system:
```
uname -a
```
At the end of the line that prints out, it should show your system architecture: `x86_64` for x86-64, or `aarch64` for ARM64:

<!-- :::danger
:warning:**Super important notes for Mac users!**
In this lab, you will be working with x86-64 assembly code, no matter what architecture your machine has. This means that if you're using an ARM64 machine (like M1/M2/M3/M4 Macs), you will need to emulate an x86-64 machine for the assignment.
<br />
**Each part of the assignment has a yellow box like the following that tells you what to do. Please read this first before trying the commands in the green boxes!.**
:::warning
<details>
<summary><img src="https://csci0300.github.io/assign/labs/assets/apple.png"> <b>ARM64/Apple Silicon Mac Instructions</b></summary><br />
We have come up with a relatively straightforward way for you to do the lab following the normal instructions, but you will need to use slightly different commands.
Throughout the handout, we will have special blocks that tell you what commands to use.
In technical terms, we will have you use a *cross-compilation* toolchain, which provides tools for your ARM64 computer to work with x86-64 executables, even though it cannot actually run them on the hardware.
</details>
::: -->
## Assignment Installation
First, open a terminal in your container environment and `cd` into your `labs` folder, then ensure that your repository has a `handout` remote. To do this, type:
```bash
$ git remote show handout
```
If this reports an error, run:
```bash
$ git remote add handout https://github.com/csci0300/cs300-s26-labs.git
```
Then run:
```bash
$ git pull
$ git pull handout main
```
This will merge our Lab 3 stencil code with your previous work.
:::warning
**You may get a warning about "divergent branches"** like shown below:

This means you need to set your Git configuration to merge our code by default. To do so, run (within the same directory in your labs repository workspace):
```console
$ git config pull.rebase false
$ git pull handout main
```
:::
If you have any "conflicts" from Lab 2 (although this is unlikely), resolve them before continuing further. Run `git push` to save your work back to your personal repository.
# Part 1: **Defusing Traps**
## Introduction
**Navigate to the `traps` directory.** In this part of the lab you'll be working with two simple puzzle programs (the `trap1` and `trap2`). Your task is figure out the correct input to give each one to defuse it. However, there's a catch: you will only have access to the **binary executables**, not the source code.
To defuse these traps, you’ll make use of the **`objdump`** utility (a program used to display information about object files and executables like the assembly code), and **GDB**.
:::success
**Helpful resources**: You may also find it helpful to use our [x86-64 Assembly cheat sheet](https://docs.google.com/document/d/17fBp2L4MRzxoeMhTRAIv4hqvOUe33vViNKQ654ynICs/edit?usp=sharing) as well as **[this reference on common assembly instructions](https://web.stanford.edu/class/cs107/guide/x86-64.html#common-instructions)**.
We’ll work through the first trap together, and then you will solve the second trap yourself.
:::
## Context: what you will do in this part
Both the `trap1` and `trap2` executables call functions with the inputs you pass in. For example, `trap1` will prompt you for one integer, and will call this function with that integer input:
```c
int trap1(int input);
```
Depending on the value of the input, this function will return `0` or `1`, where a return value of `1` will disarm the trap. If you run `trap1` with the wrong input, it will blow up the trap:
```console
$ ./trap1
Enter code to disarm the trap:
1 # type this as your input
💥💥💥💥 The trap blew up. Ouch. 💥💥💥💥
```
While you don't have access to the source code of the traps, having any executable gives you access to instructions your OS will run (i.e. the assembly code). By reading through and stepping through the trap's assembly code in GDB, you can figure out what input the function expects. Once you figure it out, you'll be able to disable the trap, like this:
```console
$ ./trap1
Enter code to disarm the trap:
<input> # in the next step, we'll walk through how to find this input
Trap 1 disarmed! Congratulations! 🎊
```
## Trap 1
Let's start by taking a look at the assembly contained in the `trap1` exectuable, so we can start to pick apart what exactly it is doing.
:::success
**Task:** Dissasemble the `trap1` binary into a `.s` file containing assembly using `objdump`.
<details> <summary>Instructions for x86-64 systems</summary>
To disassemble a program, run `objdump` like this (in this case, replace `<executable name>` with `trap1`):
```shell
$ objdump -d <executable name>
```
You can also save the output of this command by redirecting it into a file:
```shell
$ objdump -d <executable name> > saved_output.txt
```
</details>
<details> <summary>Instructions for ARM64 systems (e.g., Apple Silicon Macs)</summary>
Normally, we would disassemble binaries using the `objdump` program. However, `objdump` is designed to disassemble binaries for your only your host system's architecture (in your case, ARM64), so this won't work for x86-64 code!
Instead, we can use an x86-64-specific version of `objdump` we pre-installed in your container, called `x86_64-linux-gnu-objdump`:
To disassemble a program (in this case, replace `<executable name>` with `trap1`):
```shell
$ x86_64-linux-gnu-objdump -d <executable name>
```
<!-- < -->
You can also save the output of this command by redirecting it into a file:
```shell
$ x86_64-linux-gnu-objdump -d <executable name> > saved_output.txt
```
If you use standard `objdump`, you will see the following error:
```
trap1: file format elf64-little
objdump: can't disassemble for architecture UNKNOWN!
```
This is because the executable we provide is compiled for the x86-64 architecture and contains machine instructions that only x86-64 machines understand, but the computer you're using only understands ARM64 instructions.
<!-- </executable> </executable> -->
</details>
:::
That's a lot of text! We can fortunately ignore most of it, since the part we're interested in is the `trap1` function. `trap1` can be found in the objdump under the `<trap1>` header (around line 220). It should look like this:
```=220
00000000000008f5 <trap1>:
8f5: 55 push %rbp
8f6: 48 89 e5 mov %rsp,%rbp
8f9: 89 7d ec mov %edi,-0x14(%rbp)
8fc: c7 45 fc 1e 05 00 00 movl $0x51e,-0x4(%rbp)
903: 8b 45 ec mov -0x14(%rbp),%eax
906: 3b 45 fc cmp -0x4(%rbp),%eax
909: 0f 9f c0 setg %al
90c: 0f b6 c0 movzbl %al,%eax
90f: 5d pop %rbp
910: c3 retq
911: 66 2e 0f 1f 84 00 00 nopw %cs:0x0(%rax,%rax,1)
918: 00 00 00
91b: 0f 1f 44 00 00 nopl 0x0(%rax,%rax,1)
```
### Step 1: Find our input
By the [x86](https://simple.wikipedia.org/wiki/X86) [64-bit calling convention](https://en.wikipedia.org/wiki/X86_calling_conventions#System_V_AMD64_ABI), the first six arguments are passed in the registers `%rdi`, `%rsi`, `%rdx`, `%rcx`, `%r8`, and `%r9` (in that order).
::::info
Looking at the `objdump`, you can see that our integer input (which is located in the lower four bytes of`%rdi`) is moved into `-0x14(%rbp)`:
```=223
8f9: 89 7d ec mov %edi,-0x14(%rbp)
```
:::danger
#### :eyes: **What is `-0x14(%rbp)`? (And what are `push` and `pop` and `endbr64`????)**
By the time you read this, we might not have discussed `%rbp` in lecture yet, but don't worry! You can work on this part of the lab even if we haven't reached this point yet. **For now, the important thing to know is that addresses involving `%rbp` refer to local variables in the current function**. For example, `-0x14(%rbp)` refers to one local variable inside `trap1`, and `-0x4(%rbp)` refers to a different variable.
<br />
To provide some quick context, `%rbp`, `%rsp`, and the `push` and `pop` all involve how memory is arranged on the stack. We'll deconstruct in detail in later lectures, and you'll gain some practice with the stack in [Part 2](#Part-2-Buffer-Overflow). For now, just know that `%rbp`-based addresses refer to local variables, just like `%rip`-based addresses refer to globals. If you want to peek ahead and read more, look [here](#-Important-Background-The-x86-64-Stack).
:::
::::
### Running the first trap program
Let’s use GDB to track this location throughout the `trap1` function.
::::success
**Task:** To start, we want to run the `trap1` in GDB and pause on the `trap1` function. To do this, follow the instructions below (depending on your host platform):
<details> <summary>Instructions for x86-64 systems</summary>
To pause on the `trap1` function, do the following:
1. Run GDB on the `trap` program:
```
gdb trap1
```
2. In your GDB prompt, set a breakpoint on the `trap1` function, then run to the breakpoint with `r`:
```bash
# Set a breakpoint on the trap1 function
(gdb) b trap1
# Run to the breakpoint
(gdb) r
```
3. At this point, you should see a prompt like the figure below. The program is waiting for you to enter a number! To continue, **type a number and press enter**

4. You should now see GDB paused on the `trap1` function! It should look like this:

Now that GDB is paused, continue to the next task!
</details>
<details> <summary>Instructions for ARM64 systems (e.g., Apple Silicon Macs)</summary>
On an ARM64 system, running the `trap1` program is a bit different from how we normally use GDB, since we need to use a special version of GDB (called `gdb-multiarch`), which is designed for debugging code from different hardware architectures. We've provided a GDB script to automate this process for you. To run it:
1. Edit the file `trap1.txt` with the number you want to use to try and disarm the trap. The file should contain only a single number. When you are done, be sure to save the file.
2. Run `gdb-multiarch` using the script we provided, like this:
```shell
gdb-multiarch -ix trap1.gdb
```
3. Set a breakpoint on the `trap1` function:
```shell
(gdb) b trap1
```
4. Run the command `run-trap`:
```shell
(gdb) run-trap
```
`run-trap` is a special command from our GDB script: it runs the program using the file `trap1.txt` as input. Once it runs, you should see GDB paused on the trap1 function, like this:

Now that GDB is paused, continue to the next task!
</details>
::::
::::success
**Task**: Once GDB is paused on the `trap1` program, we can take a look at the assembly code. To do this:
1. **Run the command `layout asm`**. Remember `layout src`, showed you the source code of your program? `layout asm` is the equivalent for assembly: since we don't have the source code for this program, this is how we'll read it.
2. **If you don't see any assembly code in the view that pops up, run the command `si`**. The `si` command (short for **step** **i**nstruction) runs to the next instruction. (On some GDB versions, nothing will show up until you step at least once.)
#### Getting acquainted with assembly view
Once your assembly view is open, you should see something like this:

<br />
Take a moment to notice the components here, since you'll need them for the rest of the lab:
- The left column shows the **address** where this instruction is stored in code memory. (Remember, code lives in memory too!!!)
- The middle column shows the C function that this instruction belongs to
- The right column shows the instruction itself.
Just like when debugging C code, GDB will highlight the line (in this case, instruction) about to be run. Therefore, in the figure the `movl` instruction will be run next.
::::
### Step 2: Use GDB to examine registers
By examining the contents of registers in `gdb` we can gain more information about the state of our program (the arguments, the return value, the size of local variables, etc.)
<details><summary>What are important registers to know for this lab?</summary>
>
The x86-64 architecture has 14 registers general purpose registers and many more special purpose registers. Here are a few important registers to keep in mind while doing this lab, but check out the first assembly lecture for other x86-64 registers. It also might be useful to pull up the lecture notes as you're doing this lab.
| Register | Conventional Use | Low 32-bits | Low 16-bits | Low 8-bits |
| -------- | ------------------------ | ----------- | ----------- | ---------- |
| %rax | Return value | %eax | %ax | %al |
| %rdi | First Function Argument | %edi | %di | %dil |
| %rsi | Second Function Argument | %esi | %si | %sil |
| %rdx | Third Function Argument | %edx | %dx | %dl |
| %rcx | Fourth Function Argument | %ecx | %cx | %cl |
| %rsp | Stack pointer | %esp | %sp | %spl |
| %rbp | Base pointer | %ebp | %bp | %bpl |
| %rip | Instruction pointer | %eip | %ip | |
</details>
<br />
::::success
**Task:** Verify that `%edi` does in fact contain your input. There are a few ways you can verify that `%edi` has your input as expected:
1. `p $edi`: this command should print the contents of the register `%edi`. Generally, `p $ZZZ` will do this for register `%ZZZ`.
2. `layout regs`: This will pull up a persistent table of the registers and their contents above your assembly code. We recommend using this command throughout the lab.
3. `info r`: This will print all of the registers and their contents.
::::
### Step 3: Follow your Input
Our input was placed into an offset from `%rbp` (specifically: `-0x14(%rbp)` ). By following this address in the code, we can get an idea of how the input is being used.
You can step through a single instruction in assembly with the `si` command.
```console
(gdb) si
# some constant value is being moved into 0x4($rbp)
| 0x5555555548fc <trap1+7> movl $0x51e,-0x4(%rbp)
(gdb) si
# our input is being moved from the $rbp offset into $eax
| 0x555555554903 <trap1+14> mov -0x14(%rbp),%eax
(gdb) si
# our input in $eax is being compared to the contents of -0x4(%rbp)
| 0x555555554906 <trap1+17> cmp -0x4(%rbp),%eax
# The cmp operation subtracts the first argument from the second and
# sets a flag accordingly to indicate if the second argument is greater than,
# less than, or equal to the first.
# The instruction immediately afterwards will perform an operation
# based on the comparison flags. Stay tuned for the next instruction.
```
::::success
**Task:** We know that our input was placed into `%eax`, but to understand what the `cmp` instruction is comparing, we need to know what was placed into `-0x4(%rbp)`. Examine the contents of `-0x4(%rbp)`.
<br />
<details><summary>Hint</summary>
Since `%rbp` contains an address (specifically the base address of the current stack frame), `%rbp` - `0x4` is also an address. To print the contents at an address in GDB, you can use the `x` command to examine what's in an address. Since the `cmp` instruction is comparing the *contents* of `-0x4(%rbp)` to our integer input, it makes sense to examine the contents as a decimal integer.
For example:
```console
# examines the contents at `-0x4(%rbp)`
(gdb) x $rbp-0x4
...
# examines the contents at `-0x4(%rbp)` as a decimal
(gdb) x/d $rbp-0x4
...
```
</details>
::::
The next instruction you encounter is:
```console
(gdb) si
# sets the register %al if the
# previous comparison indicated that the second argument (%eax)
# was greater than the first (-0x4(%rbp)).
| 0x555555554909 <trap1+20> setg %al
```
:::success
**Task:** Step past the `setg` instruction, and then print out `%al`. If your input is less than or equal to the contents of `-0x4(%rbp)`, you should notice that `%al` is 0. If your input was greater than `-0x4(%rbp)`, then `%al` should be 1.
:::
### Step 4: Find the return value
Next, notice that `%al` is being moved into `%eax`.
```console
(gdb) si
# moves the lower byte from %al to %eax and zeroes out the
# higher bytes up until a long (4 bytes)
| 0x55555555490c <trap1+23> movzbl %al,%eax
```
Recall, that the `%rax` register serves as the return register, which means that the value in `%rax` at the time of the `ret` instruction will be the return value for the function. Since we want the `trap1` function to return `1` in order to disarm the trap, any input greater than the contents of `-0x4(%rbp)` will successfully pass the trap.
:::success
**Task:**
1. **Disarm the trap!**: Based on what you learned from exploring the code, run the `trap1` executable again with an argument that should disarm the trap. You should see: `Trap 1 disarmed! Congratulations! 🎊` if you did it correctly.
2. **Save your solution**: Additionally, to submit your work for the grading server, you'll need to save your solution to a file:
- **Write the argument into the file `trap1.txt`**. The grading server will read this file when you run the checkoff script.
* Before continuing, **test your file** by running the `trap1` program like this:
```shell
./trap1 < trap1.txt
```
(the `<` in this command is a *[redirection symbol](https://bash.cyberciti.biz/guide/Redirection_symbol)*, which is a special command to tell your shell to use the text file as input.)
If the test worked, you should see the trap disarmed! If not, please check the file and make sure it contains only a single number, and be sure you saved it.
:::
## Trap 2
Whoo! Congrats on getting through trap 1 :boom:. Now, you're ready for trap 2! Like the `trap1` executable, the `trap2` executable calls a function using the inputs passed in. However, unlike `trap1`, **`trap2`** expects **two integer arguments separated by a space** and will call this function with your inputs:
```c
trap2(int arg1, int arg2)
```
To disarm the trap, you need to figure out two integer inputs that make the `trap2` function return 1.
::::success
**Task**:
1. **Solve the second trap!** To do this, we recommend using the same procedures you used for trap 1 (objdump, running gdb, etc.), except that you should should replace any references to `trap1` with `trap2`, for example:
- <details> <summary>Instructions for x86-64 systems</summary>
To pause on the `trap2` function, do the following:
1. Run GDB on the `trap2` program:
```
gdb trap2
```
2. In your GDB prompt, set a breakpoint on the `trap2` function, then run to the breakpoint with `r`:
```bash
# Set a breakpoint on the trap2 function
(gdb) b trap2
# Run to the breakpoint
(gdb) r
```
3. At this point, you should see a prompt and should enter **two numbers separated by a space**, then press Enter.
4. You should now see GDB paused on the `trap2` function! Now you can continue stepping through the assembly in GDB.
</details>
- <details> <summary>Instructions for ARM64 systems (e.g., Apple Silicon Macs)</summary>
Similar to `trap2`, we've provided a GDB script to automate running `trap2` for you. To run it:
1. Edit the file `trap2.txt` with the **two** numbers you want to use to disarm the trap, separated by a space. The file should contain only the two numbers. When you are done, be sure to save the file.
2. Run `gdb-multiarch` using the script we provided, like this:
```shell
gdb-multiarch -ix trap2.gdb
```
3. Set a breakpoint on the `trap2` function:
```shell
(gdb) b trap2
```
4. Run the command `run-trap`:
```shell
(gdb) run-trap
```
Like for `trap1`, `run-trap` is a special command from our GDB script: it runs the program using the file `trap2.txt` as input. Once it runs, you should see GDB paused on the trap2 functio, and you can start stepping through the assembly!
</details>
2. **Save your solution** for grading by writing the arguments you used to solve the trap in the `trap2.txt` file on the same line, separated by a space. To test your `trap2.txt` file, you can run:
```shell
./trap2 < trap2.txt
```
:::info
>
<details><summary>Small Hint</summary>
Recall the techniques we used to solve step 1 (objdump, following the inputs, using gdb to examine registers, and finding the return value). A good first step is either to find the registers that contain your two inputs, or to find the contents that end up in the return register (`%rax`) and work backwards.
</details>
<details><summary>GDB Hint</summary>
You can break at a specific instruction using the following gdb command:
```console
// breaks at the instruction contained at the address
// 30 bytes from the start of the trap2 function
(gdb) b *(trap2+30)
Breakpoint 2 at 0x555555554983
// breaks when the instruction pointer points at a specific address
(gdb) b *0x555555554983
```
</details>
<details><summary>Bigger Hint</summary>
Notice that the assembly code for trap 2 contains instructions for a `for` loop. Here's a simpler example of a `for` loop in assembly that might help you make sense of the code:
<a href="https://cs.brown.edu/courses/csci1310/2020/assign/labs/assets/lab3-hint1.png"><img src="https://cs.brown.edu/courses/csci1310/2020/assign/labs/assets/lab3-hint1-small.png" /></a>
</details>
:::
::::
<hr />
# Part 2: **Buffer Overflow**
:::danger
:warning::warning::warning: **Warning: before moving onto this part, it is strongly recommended that you wait until we cover the stack in lecture.** We will let you know once we have covered enough material to begin Part 2.
:::
## Introduction
**The code for this part of the lab is in the `buf` sub-directory.**
You've hopefully noticed by now that because C gives you as the programmer so much power to access memory, it's very easy to modify data you weren't directly intending to modify. What happens if you accidentally give *a malicious user* the unchecked power to modify your program's data?
In this exercise you'll get to the play the role of a malicious user, and hack a program we give you. :sunglasses:
**What's a buffer overflow attack?** To avoid wasting memory in C, we often allocate memory for a well defined purpose if we want to work with it safely and meaningfully. A common mechanism to reconcile this fact with unpredicable program input/output (think user input) is to use a fixed [buffer](https://en.wikipedia.org/wiki/Data_buffer). A buffer is a reserved sequence of memory addresses for reading and writing data (you may remember that Lab 1 used a buffer before you changed it to use `getline()`). When the program writes more data to the buffer than the buffer has space for, it will overwrite data outside the buffer. This is called a **buffer overflow**.
Thus, even with well defined buffers you still need to be careful. Writing to memory willy-nilly is a surefire way to get undefined behavior... and gives clever hooligans a possible way to hack your programs :flushed:
<section>
### Background: `gets()` and buffer overflows
There is a deprecated function in the stdio library called `gets`. This function is notoriously unsafe because it is vulnerable to [buffer overflow](https://en.wikipedia.org/wiki/Buffer_overflow) attacks. Roughly speaking, a buffer overflow occurs when a program writes to memory beyond the buffer addresses and clobbers nearby data that was not supposed to be changed by the write.
The `gets` function was designed to be a convenient utility for reading a string from `stdin`. This is implemented by simply reading bytes (characters) into a buffer until the newline character (`\n`) is found.
Consider the following (somewhat uninteresting) C program:
```c
#include <stdio.h>
int main(int argc, char** argv) {
char buffer[8];
gets(buffer);
return 0;
}
```
This program reads a string from `stdin` to an 8 byte stack allocated buffer. This seems fine at first glance, but consider how this program could break given how `gets` is implemented. What happens if the user inputs more than 7 characters before they press enter?
**==Note:==** `gets` will null-terminate the input string. If the user were to input 5 characters (e.g. `hello`) and then hit enter, it would place 6 characters `[h, e, l, l, o, \0]` into memory.
<!-- The problem with `gets` is that there is no guarantee that the string read from stdin will have a null terminating character after 7 characters (`'\0'` being the 8th character). If the string is more than 7 characters plus the null character then we will just keep writing to the next memory addresses and mess up our stack! -->
</section>
## Overflow 1
In this part of the lab, we will use a buffer overflow to change the value of a constant, stack-allocated variable.
The code we are attacking is in `buffer.c`. Take a look at this file: it contains a tiny program that prints the programmers favorite number (twice) and makes a call to `gets` with a 32-byte buffer.
To get the full effect of this lab we encourage you to change the code so that `fav_number` is your actual favorite number. This will make the damaging possibilities of unsecure memory all the more real!
<!-- The compilation for `buffer.c` is a little bit more involved than standard C compilation because we need the stack to be stable and vulnerable. What this means is that we need to pass a bunch of flags to gcc to tell it to not put any modern safety features on the stack and to not treat it as [position independent code](https://stackoverflow.com/questions/14680867/what-is-the-difference-between-position-dependent-code-and-position-independent).
We are providing a Makefile for you, so you don't have to worry about these details. But check out the comments in the Makefile if you're curious what options are being passed and why. -->
:::success
**Task:** Compile the `buffer` program with `make`. This will also build another program `exploit`, which we'll use to construct our attack in the next task. Some notes about this:
- When you compile the code, **you will notice a warning that `gets()` is an unsafe function--this is normal** for the `buffer` program, since it's a sign that the program is vulnerable! (Read why [here](#Background-gets-and-buffer-overflows)).
- You may also notice that the makefile uses a lot of compiler flags we don't normally see. This is because we need to turn off lots of security features that modern compilers now use by default, which prevent the kind of attack we're doing in this lab. (See the Makefile for more info on these. If you want to learn about more modern security features, and how to defeat them, consider taking [CS 1650](https://cs.brown.edu/courses/info/csci1650/)!)
:::
<!-- :::warning
<img src="https://csci0300.github.io/assign/labs/assets/apple.png"> **Note if you're using an ARM64 machine (e.g., Apple M1)**
Using `gdb` in this part will require slight modifications. Please read carefully and ensure you are running the proper commands **within your container**; otherwise, you might see invalid `gdb` output.
You should see a file named `buffer.gdb` in your directory.
1. Create a file **`exploit.txt`** by running **`./exploit > exploit.txt`**. This file will initially contain just NUL bytes; you will modify it in the following part to inject malicious bytes.
2. Run gdb via **`gdb-multiarch -ix buffer.gdb`**.
3. You can now set breakpoints, etc., as usual. To run the program, use **`rb`** or **`run-buf`**.
If you continue to encounter errors, please post on EdStem!
::: -->
### Step 1: Your first buffer overflow
Now that we have the vulnerable program compiled, we can try it and see how it breaks! This will provide some intuition for how to construct the attack.
:::success
**Task**: To get a feel for how the program works, run `./buffer` a few times and try providing different inputs. You should notice two things:
- You'll notice that providing an input of 32 characters or less works fine and has a consistent and sane output:
```bash
$ ./buffer
My favorite number is 12 and it will always be 12 and nothing can change that
1234567 # user input
My favorite number is 12 and it will always be 12 and nothing can change that
Returned to main safe and sound
$
```
- **But what happens we go over 32 characters?** You'll find that the program doesn't behave as you expect... this is the buffer overflow! 😮
:::
To understand how a buffer overflow occurs, it's useful to consider what is happening on the stack. **Think back to what we talked about in lecture**: in terms of the stack, what happened when we entered too many bytes?
<!-- :::info
**Sample Walkthrough:** To understand how a buffer overflow occurs, it is very useful to visualize what is happening on the stack. We put together [**these slides**](https://docs.google.com/presentation/d/1QSZg-QRuvo0sZo7nkID0oaO4XhftpaZgkXRE5RuLe44/edit?usp=sharing) walking through a sample execution of `buffer`.
::: -->
### Step 2: A more precise overflow (with GDB)
Our initial overflow was pretty naive: we managed to change the number, but it also caused the program to crash! In a real attack, we not only want to be able to control the program's memory, but we also need to make sure the program doesn't crash so it can keep running (and do something useful for us).
To figure out how to overflow more precisely, we can run the `buffer` program in GDB to figure out the program's stack layout, and then construct a more precise overflow that only corrupts the bytes we want.
::::success
**Task:** Using the instructions below, use GDB to figure out an input to provide to `./buffer` such that you cause a buffer overflow to (tragically) change `fav_number` to **anything but 12** at runtime. Your overflow input **should not** cause the program to segfault.
To avoid typing out long input strings each time, we can compose our exploit in a text file `exploit.txt`. In security terms, this is called an *exploit payload*. We'll start by constructing the payload manually, and then we'll write a program to do it in the next task. Here's how--see the instructions below, then look at the hints for how to make the input:
1. Create a file `exploit.txt` with an input you want to pass to `buffer`. For your first attempt, just add a couple (less than 32) of random characters so you can get used to the process.
2. Run the `buffer` program in GDB, using `exploit.txt` as input:
- <details> <summary>Instructions for x86-64 systems</summary>
1. Run the `buffer` program with GDB:
```
gdb buffer
```
3. Set a breakpoint in the `foo` function, or anywhere else you want to pause
```
(gdb) b foo
```
4. Run the program, using exploit.txt as input
```
r < exploit.txt
```
After starting the program, you should hit a breakpoint in `foo` and be able to explore memory--see the later steps and hints for details. Remember that you have the source code for buffer.c, so you can use `layout src`!
</details>
- <details> <summary>Instructions for ARM64 systems (e.g., Apple Silicon Macs)</summary>
Similar to the traps programs, we've provided a special GDB script to run the `buffer` program with the correct options for your system:
1. Run the `buffer` program with `gdb-multiarch`:
```
gdb-multiarch -ix buffer.gdb
```
3. Set a breakpoint in the `foo` function, or anywhere else you want to pause
```
(gdb) b foo
```
4. Run the program using our helper command `run-buf`:
```console
(gdb) run-buf # This reads exploit.txt automatically
```
`run-buf` is a special command from our custom script: it reads the content of your `exploit.txt` and then starts the program with the correct settings to run for yoru architecture. The name `exploit.txt` is hard-coded in the command, so make sure your exploit data is in this file!
</details>
After starting the program, you should hit a breakpoint in `foo` and be able to explore memory--see the later steps and hints for details. Remember that you have the source code for buffer.c, so you can use `layout src`!
3. Once you're able to run the program on your system, your GDB should be paused at a breakpoint in the `foo` function. From here, how can you use GDB to figure out how many bytes you can overwrite to change the number? (See the hints!)
4. When you have an idea, update your `exploit.txt` and try running the program again. You can run the program in GDB (as above), or like this:
```
./buffer < exploit.txt
```
Your goal should be able to see the number change to any value, but **without segfaulting**. It's okay if this takes a few tries! Take a look at the hints; if you get stuck, feel free to move onto the next task (which describes a more systematic method).
<br />
<details><summary>✨ Hints! ✨</summary>
- We know that the buffer is only 32 bytes so writing more than 32 characters will overflow into other stack memory. But how do we know how much to write to get to the stack memory associated with the variable `fav_number`?
One way to do this is to use gdb to print out the address of `buffer` and `fav_number` and see how many bytes away they are:
<table>
<tr><td>
*(Don't pay attention to the exact numbers here, since the addresses could be different on your system!)*
```bash
... Break on the foo function using instructions for your system ...
(gdb) p &buf
$1 = (char (*)[32]) 0x7fffffffe330
(gdb) p &fav_number
$2 = (const int *) 0x7fffffffe35c
```
</td> </tr> </table>
We see here that the stack address of `fav_number` is 0x2c=44 bytes ahead of the buffer so we need to write 44 characters to start affecting `fav_number`
- *In order to not segfault, *don't write over more of the stack than you need*! Remember that some of the values on the stack are used to manage stack frames and the processor will freak out if this gets messed up.
- For this task, you don't need to set `fav_number` to a specific number for this task; anything that changes its value is fine.
</details>
::::
### Step 3: building a real exploit
Now it's time to do a real attack and change the number to the number we want.
Previously, we just typed our input directly into a text file, but this will be tricky for constructing a real attack: the data we want to input into the buffer won't necessarily be ASCII (or Unicode) characters, so we can't really type them out. Instead, we'll write an *exploit program* that will construct the payload for us.
We've provided a file `exploit.c` that creates the payload and prints it out for you. By default, it creates a payload of 32 null bytes and prints them out--take a look at this file to see how it works.
:::::success
**Task:** Use the `exploit` program to create a payload that changes `fav_number` to 131. Your exploit should not cause the program to segfault.
<details> <summary>Instructions: how to use the exploit program</summary>
Here's how to use the exploit program to do this:
1. Edit `exploit.c` with the bytes you want to pass to the buffer program. This is the only file you should need to edit to do the exploit. Seethe comments in this file for details on how it works.
2. When you're ready to test, create your payload by building and running the program, writing the output to a file:
```console
make # Build the exploit
./exploit > exploit.txt # Write the output to a file
```
3. Run the buffer program using GDB (to see the stack), or directly, using the steps from the previous task.
:::info
**Pro tip**: you can build the exploit and run it one step by running `make run_exploit1`. However, don't forget that you should run it with GDB to see what the stack looks like!
::::
</details>
<details><summary>Hints</summary>
- When you change `exploit.c`, don't forget to recompile the program and write the output to a file (`./exploit > exploit.txt`)! `make run_exploit1` will do all of this for you, but if you're testing manually or using GDB, you'll need to do these steps yourself.
- The decimal number 131 is 0x83 in hexcadecimal.
- **How `gets` works**: As soon as the newline character (0x0a) appears in the input, `gets` will stop reading data and will replace the newline character with the null terminator (0x00). For more info on this, see the manual page for `gets`.
- You may find it useful to look at the bytes you are writing in GDB. The gdb examine copmmand (`x`) might come in handy. The syntax for this command is `x/(number)(format)(unit size)`. So, if we wanted to print out the 32 bytes of memory at the address of `buf` as hexadecimal bytes the command would be:
```
x/32xb &buf
```
- A good way to tackle this problem if you get stuck is to use GDB to step through `foo()` and examine the buffer memory addresses. Look for your favorite number (in hexadecimal)! You can format your exploit according to the memory dump.
:::info
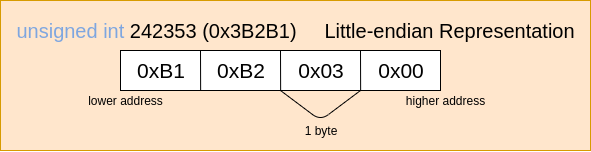
- Remember that your computer (and thus, your course container) uses a 64 bit architecture with [little-endian](https://en.wikipedia.org/wiki/Endianness) data representation. That means that if we have a 4-byte integer in memory, it will be stored with the least significant bytes first:
Keep this in mind when writing to memory!
:::
- You may find **[this background section](#-Important-Background-The-x86-64-Stack)** (mostly for the next task) helpful for this task as well!
</details>
<details> <summary> When you are done: how to save your work for grading </summary>
Once you have your exploit working, run the following command:
```
make run_exploit1
```
This will run your exploit and save the output to `exploit1.txt`, which the grading server will read check your work. If this didn't work, please make sure your `exploit.c` is correct.
:::::
<section>
## :eyes: Important Background: The x86-64 Stack
For the next task, it's important to understand the x86 [call stack](https://en.wikipedia.org/wiki/Call_stack). A call stack memory organization that enables function calls and local variable access with automatic lifetime. Keep in mind that **the stack grows downward in memory**, meaning that the "top" of the stack is the lowest memory address in the stack.
If you feel comfortable with this from lectures, feel free to directly move on to the buffer overflow. If you're not sure, you may want to go through some or all of the walkthrough below!
<details>
<summary> <span style="color:blue; font-weight: bold">Click here for a detailed walkthrough on the stack!</span> </summary>
We are going to track an x86 call stack through a sequence of function calls. Consider the following code snippet (found in `example.c`) as an example:
```clike
#include <stdio.h>
void bar(int a) {
int b = 8;
printf("%d\n",a + b);
}
void foo(int a) {
bar(a);
}
int main() {
int a = 8;
foo(a);
}
```
The compiled assembly for these functions is given below (courtesy of objdump):
<details>
<summary> <span style="color:blue"> Assembly code </span> </summary>
``` asm
000000000000064a <bar>:
64a: 55 push %rbp
64b: 48 89 e5 mov %rsp,%rbp
64e: 48 83 ec 20 sub $0x20,%rsp
652: 89 7d ec mov %edi,-0x14(%rbp)
655: c7 45 fc 08 00 00 00 movl $0x8,-0x4(%rbp)
65c: 8b 55 ec mov -0x14(%rbp),%edx
65f: 8b 45 fc mov -0x4(%rbp),%eax
662: 01 d0 add %edx,%eax
664: 89 c6 mov %eax,%esi
666: 48 8d 3d d7 00 00 00 lea 0xd7(%rip),%rdi # 744 <_IO_stdin_used+0x4>
66d: b8 00 00 00 00 mov $0x0,%eax
672: e8 a9 fe ff ff callq 520 <printf@plt>
677: 90 nop
678: c9 leaveq
679: c3 retq
000000000000067a <foo>:
67a: 55 push %rbp
67b: 48 89 e5 mov %rsp,%rbp
67e: 48 83 ec 10 sub $0x10,%rsp
682: 89 7d fc mov %edi,-0x4(%rbp)
685: 8b 45 fc mov -0x4(%rbp),%eax
688: 89 c7 mov %eax,%edi
68a: e8 bb ff ff ff callq 64a <bar>
68f: 90 nop
690: c9 leaveq
691: c3 retq
0000000000000692 <main>:
692: 55 push %rbp
693: 48 89 e5 mov %rsp,%rbp
696: 48 83 ec 10 sub $0x10,%rsp
69a: c7 45 fc 08 00 00 00 movl $0x8,-0x4(%rbp)
6a1: 8b 45 fc mov -0x4(%rbp),%eax
6a4: 89 c7 mov %eax,%edi
6a6: e8 cf ff ff ff callq 67a <foo>
6ab: b8 00 00 00 00 mov $0x0,%eax
6b0: c9 leaveq
6b1: c3 retq
6b2: 66 2e 0f 1f 84 00 00 nopw %cs:0x0(%rax,%rax,1)
6b9: 00 00 00
6bc: 0f 1f 40 00 nopl 0x0(%rax)
```
</details>
<details>
<summary> <span style="color:blue"> How we got this assembly </span> </summary>
```gcc -O0 example.c -o example && objdump -d example```
</details>
<br>
Don't worry if you don't understand everything that is going on in the assembly code! Notice though that certain registers are frequently used in similar ways, especially at the start and end of function code.
At any given point, the execution of a computer program can be entirely described by the values within 3 registers
- `%rbp` : 64-bit address in the stack segment that is the base of the current stack frame (a.k.a. **base pointer**).
- `%rsp` : 64-bit address in the stack segment that is the top of the current stack frame (a.k.a. **stack pointer**)
- `%rip` : 64-bit address in the text segment that is the address of the next instruction to be executed (a.k.a. **instruction pointer**).
Between the values in `%rbp` and `%rsp` we know the location of the current [stack frame](https://en.wikipedia.org/wiki/Call_stack) (and therefore the local variables and arguments available to us) and with the value in `%rip` we know what instruction we're executing.
**==Note:==** When an x86 CPU performs a `push` instruction the value in `%rsp` is automatically decremented by the size of the data pushed. The `pop` instruction automatically increments the value in `%rsp`. In effect, these two instructions grow and shrink the current stack frame.
Every time the computer executes a normal instruction, `%rip` gets automatically incremented to the next instruction. Certain special instructions can "jump" or put an address into the instruction pointer that is not the next sequential address. This is how functions and branch logic (e.g. `if` and `for` statements) work at the register level.
The x86 calling convention uses two special jumping instructions:
- `call <addr>`. The assembly instruction for calling a function. It stores `addr` into `%rip` to begin executing that part of the text section. **This function also pushes the current instruction pointer (`%rip`) onto the stack**
- `ret` The assembly instruction for returning from a function. This instruction pops the top of the stack into `%rip`.
<!-- **==Note:==** The "q" suffix in x86 assembly means "quad". All this does is specify that the operation is performed on a 64 bit operand. For instance `callq` means call a function with a 64 bit address. -->
<!-- Lets take a look at these instructions in action! -->
Looking at the instruction at address **0x00000000000006a6** we see a call to foo. (some investigation of the assembly code will reveal that **0x000000000000067a** is the address of `foo` in the code segment)
```asm
6a6: e8 cf ff ff ff callq 67a <foo>
```
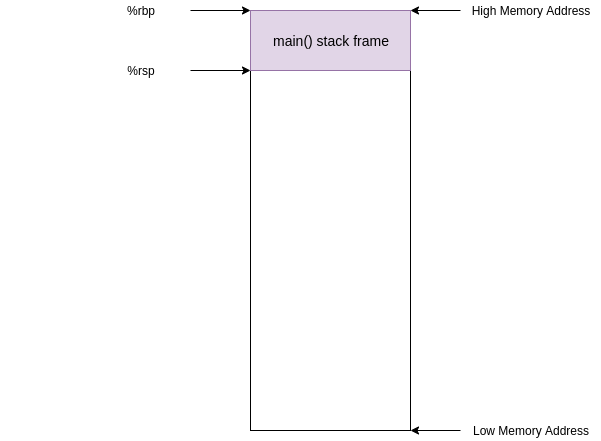
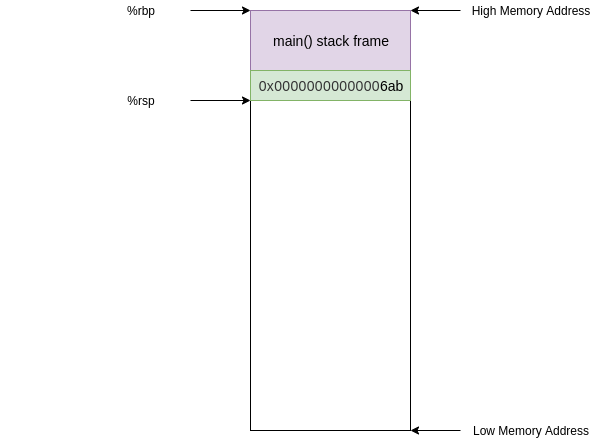
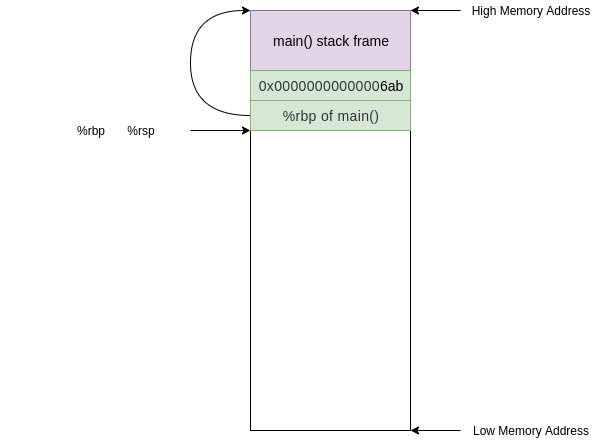
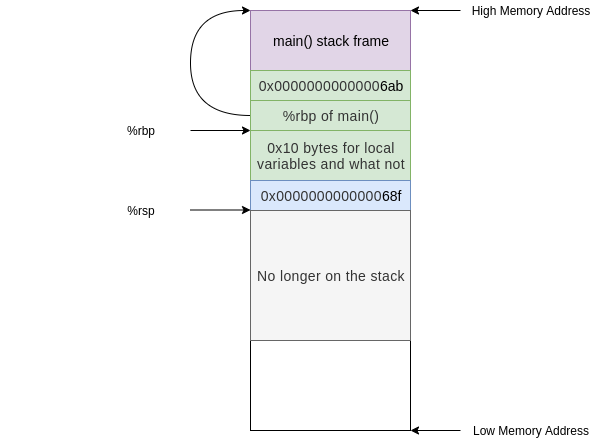
Before this instruction, `%rip` contained the address of the next instruction (**0x00000000000006ab**) and the stack looked something like this
After this instruction `%rip` contains the address of `foo` (**0x000000000000067a**) and the old value in `%rip` was pushed onto the stack
The next instruction we execute will be at the address of `foo` in the code segment:
``` asm
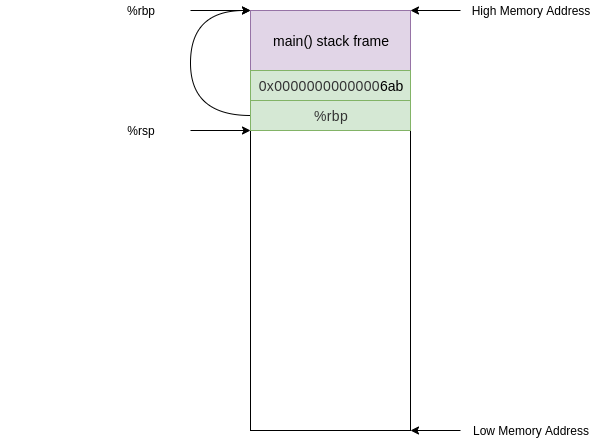
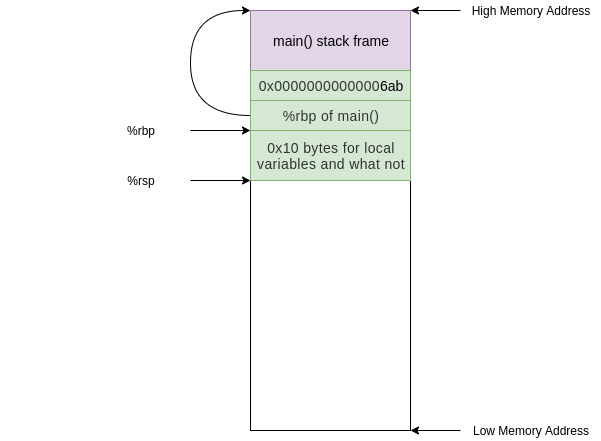
67a: 55 push %rbp
```
This instruction simply pushes the current `%rbp` value onto the stack. Now the value at the **top** of our stack is an address that points to the current **base** of our stack (along with `%rbp`)
`push` is not a jumping instruction so the next instruction we execute will be the next sequential instruction at address **0x000000000000067b**
``` asm
67b: 48 89 e5 mov %rsp,%rbp
```
This instruction updates the base pointer by moving the current stack pointer value into the base pointer. Now the value on the top of the stack is the "old" base pointer from main and the current base pointer points to the top of the stack.
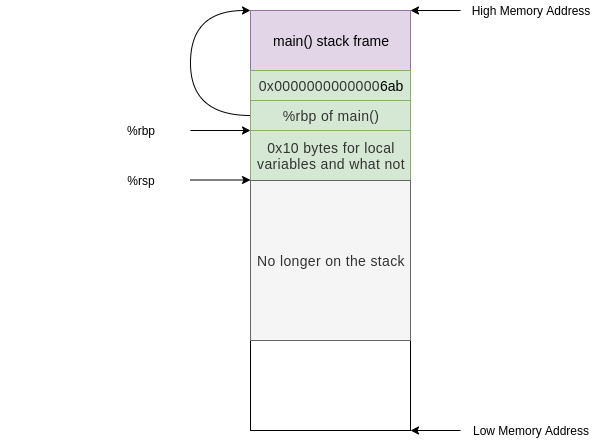
We are almost done setting up the stack frame for `foo()`. All we need is some allocated space to deal with local variables. Our next instruction does exactly this:
``` asm
67e: 48 83 ec 10 sub $0x10,%rsp
```
This has moved the top of our stack 0x10 (or 16 in decimal) bytes down and therefore allocated 0x10 bytes.
<details> <summary><i>Why 16 bytes?</i> </summary>
The reason we need 0x10 of space is because of [alignment](https://en.wikipedia.org/wiki/Data_structure_alignment). We only need 0x4 bytes to store the `int` argument on the stack but because of some [x86_64 shenanigans](https://stackoverflow.com/questions/5538079/why-alignment-is-16-bytes-on-64-bit-architecture) the stack pointer must be 16 byte aligned.
</details>
After this instruction our stack looks like this:
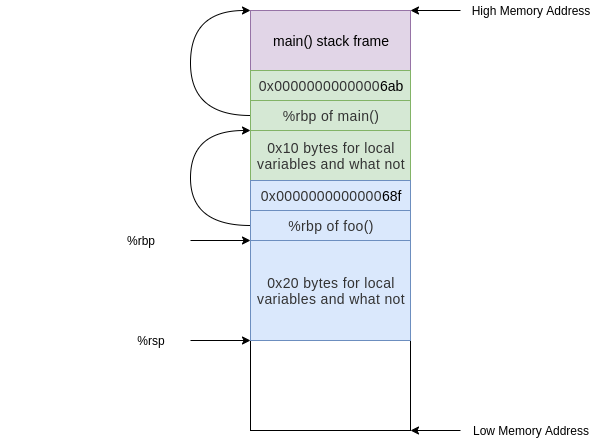
At this point in the execution we have the stack frame established and we perform a task. The only task that `foo()` does is call `bar()`, we see this in the instruction at address **0x000000000000068a**:
```asm
68a: e8 bb ff ff ff a callq 64a <bar>
```
At this point the stack would undergo the same process as above but instead starting from the foo() stack frame and allocating 0x20 bytes instead of 0x10:
Now we've built the stack for the functions in our program... but how about cleanup?
Before the function `bar()` returns it uses the `leaveq` instruction.
```asm
678: c9 leaveq
679: c3 retq
```
`leaveq` is a convenient instruction that optimizes/condenses the collapse of a stack frame. The effect of the `leaveq` instruction is equivalent to the following sequence of instructions:
```asm
mov %rbp,%rsp
pop %rbp
```
This first moves the current base pointer value into the stack pointer. Effectively resetting any of the space subtracted for local variables when we set up the stack frame.
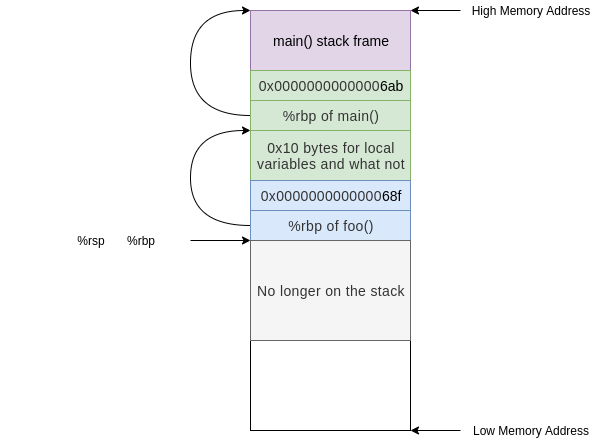
Next we pops the value at the top of the stack into `%rbp`, restoring the base pointer to the base pointer of `foo()`
After the `leaveq` instruction we are ready to go home and call `retq`. This pops the address of the next instruction in `foo()` after the call to `bar()` into `%rip`. Now we are executing instructions in `foo()` and the stack frame we have is exactly that of `foo()`
This is the call stack mechanism by which functions call and return. Hopefully it is clear how scope is created and removed from the stack and how it is possible to move into a previous stack frame.
</details>
</section>
## Overflow 2
:::warning
**Note that you _must_ develop your exploit for this part of the lab inside your course container**. If you build the buffer executable outside the course container, differing compiler and linker versions may change the addresses you need to work on this part, which means that your solutions will not work on the grading server.
:::
Now let's do a more valuable attack: instead of just changing a number, let's modify the program's stack to *run different code* than what the program was supposed to run. We have written an unused function `hack()` in the `buffer.c` file: your job is to *somehow* execute this function at runtime without modifying the code in buffer.c.
You can check if your solution works by running `make run_exploit2` and checking if the text in the `hack` function gets printed.
:::::success
**Task:** Use the `exploit` program to create a payload that causes the program to execute the `hack()` function. Again, your exploit should not cause the program to segfault.
To implement this, you should leverage all of the tools and methods we've learned from the previous steps:
<details><summary>Hints!</summary>
- For help using GDB and running the tools, see the instructions in our previous steps. The closest example will be the first overflow program: in this version, you will be creating a payload in the same way, but with a different goal.
- Consider targeting the `retq` instruction to load a particular address into `%rip`. From where does `retq` take a value? For more info on this, see [this section](#-Important-Background-The-x86-64-Stack), and our lecture notes!
</details>
<details> <summary>When you are done</summary>
Once you have your exploit working, run the following command:
```
make run_exploit2
```
This will run your exploit and save the output to `exploit2.txt`, which the grading server will read check your work. If this didn't work, please make sure your `exploit.c` is correct.
</details>
:::::
# Handin instructions
Turn in your code by pushing your git repository to `cs300-s26-labs-YOURUSERNAME.git`.
Then, head to the [grading server](https://cs300.cs.brown.edu/grade/s26). On the "Labs" page, use the **"Lab 3 checkoff"** button to check off your lab.